| Author | Robb Hoff |
| Written | 12 Dec 2015 |
| hoff.rj@gmail.com | |
Based on historical exchange rates collected from Bitcoin exchanges, shown in the table below
(OkCoin, Bitstamp, Btcn, BTCe, etc.). My simulation models in applying what I've labelled the
delta function Δ(-min,max) attempts to execute orders on a given exchange under observation
when prices fluctuate compared to a weighting function I've developed (not described here in detail,
whilte providing some reasoning below). Here the Δ(-min,max), for example Δ(-1,1) is an attempt to
describe how much under- or over-valued the price is at a given time is (in dollars).
Executing on Δ(-1,1) on the exchange
BTCe (a Russian based exchange), my simulation running across historical data indicates if starting with
$1 and exectuting a sell or buy instruction
immediately after threshold events are triggered will turns a cumulative gain of about 28-fold in the
period Jan 2015 to Sep 2015. Results shown here
BTCe simulation (-1,1) againts mean-ind.
The Java class generating the simulation is shown here:
SimulationThresholdEvents.java
Summary of the Java classes of the project
code-summary.pdf
| Exchange | Freq. (Sep) | Vol (in USD) | Trade-fee | Charts, Jan-Sep 2015 |
|---|---|---|---|---|
| OkCoin (CNY)
|
2,420,000 | 354M | 0.2% | okcoin-charts |
| Bitstamp (USD)
|
127,000 | 115M | 0.4% | bitstamp-charts |
| Btcn (CNY)
|
1,640,000 | 107M | 0.2% | btcn-charts |
| BTCe (USD)
|
115,000 | 36.9M | 0.2% | btce-charts |
| Kraken (EUR)
|
60,400 | 22.7M | 0.5% | kraken-charts |
| ANX (USD)
|
52,800 | 5.65M | 0.4% | anx-charts |
| Bitcurex (PLN)
|
12,000 | 4.72M | 0.4% | bitcurex-charts |
| HitBtc (USD)
|
16,500 | 2.45M | 0.4% | hitbtc-charts |
| Mercado (BRL)
|
4,600 | 649K | 0.5% | mercado-charts |
Data collected from records or APIs provided by exchanges.
All exchanges above support real-time trading, either by polling or streaming services.
Trade instructions are near instantaneous, latencies in the range 0.5 to 5s.
Chinese-based exchanges make up the largest market, the two largest exchanges globally (by volume
and frequency) are OkCoin and Btcn both trading on CNY. Although,
the Chinese exchanges are suspected
of artificially inflating their data and most likely are.
link
All trade-data is converted to USD using historical or real-time FX-rates sourced
on openexchangerates.org
![]()
The data and derived charts are maintained in local databases,
in this analysis from 1 Jan 2015 to 26 Sep 2015 there are 32 million
trades on record.
Large exchanges (OkCoin, Bitstamp, Btcn, BTCe and Kraken) exhibit relative stable
swings and less "noise" along the plot. Particularly Chinese exchanges (OkCoin and Btcn)
are very stable, possibly due to technical assistance, or in-house "market-making" activity;
the exchange itself will make proprietary trades in response to market deviations.
A typical large-exchange
interval
draws as a continuous and thin line.
The large, or large-to-medium, European exchanges (Bitstamp, BTCe and Kraken),
are also "pretty" stable,
selected
intervals have the same characteristics as okcoin and btcn. Other periods, for example
btce 29-34 Aug
and
kraken 29-34 Aug
exhibiting considerable small-scale swings. Such swings are identified as weak depth in the order-book,
parties that sell or buy large amounts over a short window will induce spikes due to
this fragility in "market strength".
The medium to small exchanges (anx, Bitcurex, Hitbtc and Mercado) have greater volatility,
shown as an erratic and spiky character of their movement. Often, such as
hitbtc 24-29 Aug,
still show continuous and "well behaved" graphs (also a signal that the wider Bitcoin markets
are in a placid period), but commonly are
erratic and "hairy".
This is particularly true for very-small exchanges such as
Mercado (Brazil based, trading in BRL - Brazilian Real); this chart-series is consistently unstable.
In these cases the spikes are additionally due to large bid-ask "spreads";
the difference between the lowest buy-offer and highest sell-offer.
Market Opportunity
Single-exchange data provides some opportunity on trading, we are interested in arbitrage-trading
principally, as opposed to technical-trading. Technical-trading, that relies on single-exchange indicators,
such as "oscillators", "trend-lines", "trailing stops" and so on is common; widely used
by amateurs and largely a waste of time (in my opinion).
Another different and profitable type of trading is manipulation-trading;
where illegal in regulated markets,
Bitcoin is not under any jurisdiction and exempt, yet arguably still unethical.
Manipulation-trading is not considered here but is probably common in the wider market
(even the market-providers do it
link).
Arbitrage-trading, which is what we are interested in, is concerned by price deviation.
If there are swings, preferably large, arbitrage opportunities are created where one can either
"buy cheap" or "sell high". Most types of arbitrage is identified by market-comparisons,
which means that looking at single-exchange data by itself
will not reveal the kind of opportunities that we
want. Although, there are at least two exceptions where arbitrage can also be discerned from
a single-exchange.
1. The most common of these is a direct relationship of large spreads. High
spreads is a character of small-to-medium exchanges, and therefore only applies to them.
For example
mercado 29 Aug - 3 Sep,
at t=1.8 days, selling at 247 and buying at 237 on this time-frame represents a 4% opportunity.
2. The other type of single-exchange arbitrage are due to price spikes with
near-vertical gradients, above a certain gradient it is possible to rule
out that the swing is due to "market response"; and must have happened
either by a rapid sell-off or rapid buy-in. If a party places a huge order on a market
a "vacuum" results that will dig deeply in to the standing orders.
Btce experienced this on
17 July 2015
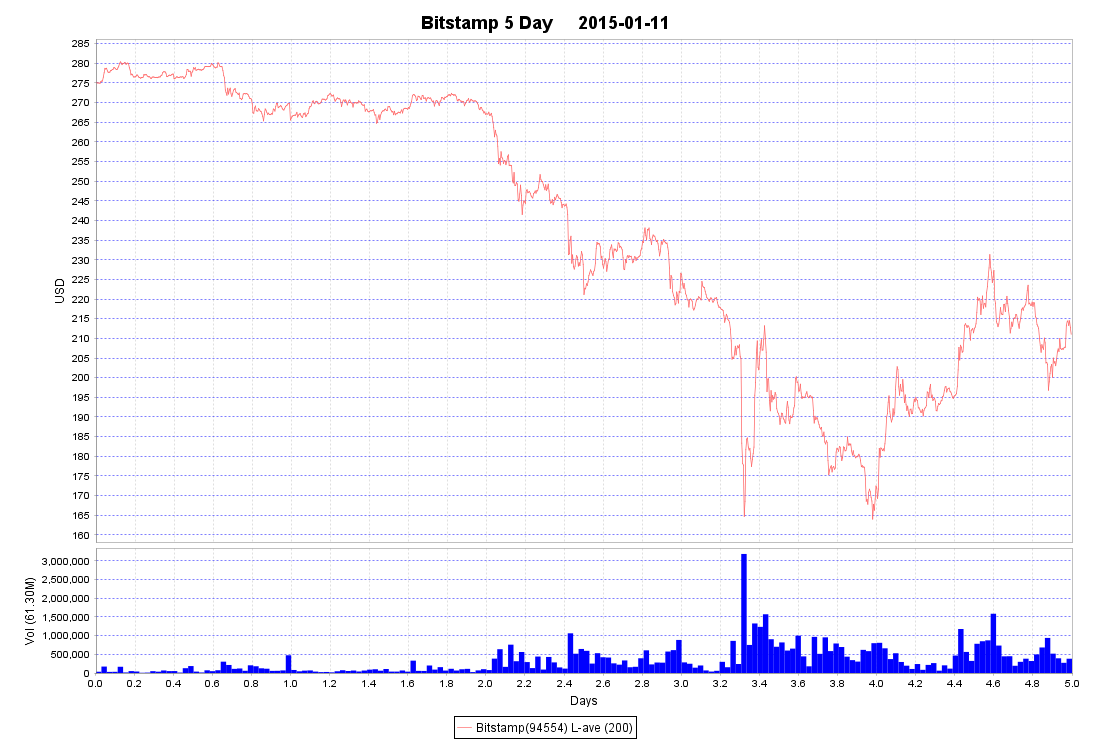
(at t=3.4 days), and a famous example occurred on Bitsamp on
14 Jan 2015
(t=3.3) that caused turbulence of the wider market for a week following (the volume-bar
shows the magnitude to the order of 3 million USD. It is worth noting how extreme this
event is in financial terms, more details
here).
Such "flashes" are usually expressed as depressions because it is more common
for market-participants to sell in panic rather than "buy in panic", but they occur
the other way around occasionally, and also on large exchanges. Okcoin shows a positive spike on
20 Aug 2015
(t=1.4) with associated volume around 7 million USD.
Considering arbitrage between exchanges; a starting point is the consideration of exchange-pairs.
| Exchange-pair | Interval | |
|---|---|---|
| Bitstamp,Btce | 1 Jan - 26 Sep 2015 | bitstamp-btce charts |
| Okcoin,Btcn | 1 Apr - 31 May 2015 | okcoin-btcn charts |
(the graphs okcoin-btcn are drawn from earlier this year because
of gaps in data)
Both of these datasets show relative price movements between exchanges.
A general feature in these comparisons is the tendency for the price between exchanges
to cascade together, price-movements are expressed almost instantaneously
or with small Δt between.
This is true for both sets, such as
bitstamp-btce 2015-5-14, the up and down spikes at t=21.5 happen on both exchanges.
However, for whatever reason (unknown), the Chinese exchanges exhibit a much higher degree
of unison; such as on
okcoin-btcn 2015-5-13 even the rapid fall (t=22) in tight coupling.
(A possible reason for the Chinese coupling may be that the exchanges are cooperating, or,
they are providing trade-technologies, or otherwise exhibit some distinction, not expressed
by other exchanges)
Price difference
The basic idea of arbitrage is when price difference occur between two exchanges,
and particularly if the difference is large, a working hypothesis is that
either one or the other is over- or
under-valued (against some wider market understanding).
An analysis that gives context to this is to subtract one exchange less the other,
arriving at a moving deviation.
| Exchange-pair | Interval | Technique | |
|---|---|---|---|
| Bitstamp,Btce | 1 Sep - 26 Sep 2015 | Difference in price on (-6,6) subplot | bitstamp-btce-shift |
| Bitstamp,Btce | 1 Aug - 26 Sep 2015 | Normalised difference in price on (-6,6) subplot | bitstamp-btce-norm-shift |
| Okcoin,Btcn | 24 Aug - 15 Sep 2015 | Difference in price on (-6,6) subplot | okcoin-btcn-shift |
In the first of these the subplot shows Bitstamp less btce producing a graph that is
more or less contained in a (-6,6) USD window.
And the third dataset okcoin-btcn uses the same analysis.
The moving price difference of okcoin-btcn shows the subplot approximately stuck at zero
most of the time. Since we are motivated by price difference this does not seem like promising ground
for our strategies. However, occasionally on the okcoin-btcn pair there are some
interesting behaviour.
On
okcoincny-btcn_2015-09-08 there is a spike touching -2 USD, on
okcoincny-btcn_2015-09-05 touching 1.5 USD, on
okcoincny-btcn_2015-08-26 touching 2 USD, and on
okcoincny-btcn_2015-08-24 touching -5 USD. Note in passing is that it is not only the USD
difference that plays a part in the size of a potential opportunity, there are two other main factors,
namely volume and trade-fee. For example, in the price ranges of Sept 2015, executing on
a 2.5 USD difference on 0.5% fee
will turn the same profit as a 1.5 USD difference on 0.2% fee. (both turning ~0.4% profit)
Notwithstanding the greater liquidity and lower fees of the Chinese markets, it is safe to say that the
European exchanges Bitstamp and btce are much more interesting as trading prospects
(at least relative to each other).
A technique that I've been working with, and seems in practise to work well, averaging out (according to my function)
the moving differences,
labelled normalised difference and applied in the
bitstamp-btce-norm-shift
series. The logic in doing this is that some exchanges exhibit consistent deviations compared to others,
as in the bitstamp-btce charts series it is apparent
that the asset tends to cost a bit more on Bitstamp than on BTCe.
This is probably correct for practical reasons; once sold the
resulting "USD" still resides on the exchange and to arrive as cash has to undergo
external fees and transaction costs that are imposed both by the exchange and participating banks,
the exact process of withdrawal individual to each exchange. Inspecting the withdrawal systems of Bitstamp
and BTCe (provided on their websites), Bitstamp uses SEPA (Single Euro Payments Area) transactions and
have lower withdrawal fees; both of these factors are advantageous compared to
systems provided on BTCe, so Bitcoins have marginally less value on BTCe with the implied overheads.
The reason though why exchanges exhibit shifts is
not itself considered important, the important part is simply that they do.
If one dataset is always higher than the other the market assumption in itself makes it
true. A consequence of exchange-shifts suggests an interesting fact that a trade turning
negative USD may actually be profitable if done on variations
between a low- and high-shift exchange (and it's even implied in parts of my analysis that this can even be common).
Another feature in normalisation are that negative swings become equally common as positive, centred at zero
the areas on both sides are equal. This has an important implication in preventing movement of
funds towards any particular source. The most practical trading strategies are
ones that exhibit vectors keeping the relative quantities of USD and BTC in balance. Any other
strategy would need manual assistance where either one of the quantities bottom out.
Basic-attempt, and selected expression
A basic idea on utilising price difference is to issue trades according to some threshold.
Towards this idea the following approach extracts a series of oscillating peaks against a Bitstamp-BTCe
moving difference. While this technique is not applicable to real-time trading it is
useful for sifting the best opportunities in retrospect, towards analysis of their characteristics.
oscillating peaks on (-3,3) threshold
series: bitstamp-btce-norm-shift

2015-08-01 01:01:51,  3.2366
2015-08-07 06:15:14,  -3.8858
2015-08-07 20:58:33,  5.3249
2015-08-08 12:09:39,  -3.4363
2015-08-08 22:28:31,  5.2388
2015-08-12 02:28:35,  -4.5868
2015-08-16 13:30:58,  4.7374
2015-08-16 20:05:36,  -3.0321
2015-08-17 03:49:39,  3.7516
2015-08-18 08:02:13,  -3.6400
2015-08-18 20:11:52,  4.8763
2015-08-19 00:00:36,  -11.0468
2015-08-19 03:47:36,  3.4528
2015-08-19 07:53:56,  -3.6358
2015-08-19 22:01:47,  7.7833
2015-08-20 10:07:01,  -3.1868
2015-08-23 10:17:25,  4.0537
2015-08-24 12:05:28,  -4.7118
2015-08-24 14:25:01,  3.2404
2015-08-24 14:54:52,  -3.3426
2015-08-24 17:45:59,  6.2698
2015-08-25 15:33:26,  -3.6834
2015-08-25 20:32:11,  4.3080
2015-08-26 02:36:22,  -4.0154
2015-08-27 23:26:08,  3.5317
2015-08-28 03:25:55,  -3.6246
2015-09-07 02:13:00,  4.5877
2015-09-07 14:53:49,  -3.7546
2015-09-12 14:34:39,  3.4250
2015-09-14 02:17:31,  -3.4915
2015-09-14 20:16:05,  3.1684
2015-09-15 07:43:43,  -3.6170
The highest deviation, which also happens to be hard to spot
manually, is the 2015-08-19 00:00:36, -11.0468, details of this event is
considered
here.
The consideration suggests a simple strategy could potentially
turn a profit of 5% on a 10,000 USD investment (across Δt = 2 hours).
Simulation on threshold events (naive model)
Pursuing this idea we can run a simulation across thresholds across a greater duration,
while this is still a naive model, still, if trades are
pursued on (-2,2) boundaries on the Bitstamp, btce pair we produce the following
Note here - this technique is applicable to real-time trading using threshold events,
while oscillating events above is defined as peaks, thresholds measure passing fluctuations against
a preset absolute value.
event-time            Δ          trade-on-record (USD)      position                gain     Π-gain
2015-08-01 14:57:21  -2.3238     277.20 (14:59:16)          277.20 (bid)
2015-08-02 10:12:00   2.0696     279.01 (10:12:10)          279.01 (ask)            1.007    1.007
2015-08-02 11:06:58  -2.1326     279.23 (11:07:08)          279.23 (bid)
2015-08-02 23:23:19   2.4289     282.47 (23:23:29)          282.47 (ask)            1.012    1.018
...

2015-09-22 04:21:05  -2.4912     225.15 (04:21:14)          225.15 (bid)
2015-09-22 13:45:12   2.1367     230.83 (13:45:18)          230.83 (ask)            1.025    1.238
2015-09-25 05:23:22  -2.1092     233.50 (05:23:27)          233.50 (bid)
2015-09-25 14:18:25   2.1120     236.41 (14:18:35)          236.41 (ask)            1.012    1.253
complete record here
As remarked, the boundaries (-2,2) strictly derived from trades t<0
The simulation is considered as a Bitstamp participant, and using a preset trading
amount set to 1 USD (to match percentage increases). We assume that on a negative threshold
we buy on the trade opportunities following the threshold timestamp. The column 'gain'
is the percentage profit assuming that, in a similar fashion, we sell at positive threshold.
And the column 'Π-gain' is the successive product of all the pair-wise gains.
The model suggests, following this strategy, that we would make a 25% profit for the period
of Aug-Sep 2015.
Simulation on threshold events (naive model, Jan-Sep 2015)
If we run the same model, now drawn back to Jan 2015 we get the following
event-time            Δ          trade-on-record (USD)      position                gain     Π-gain
2015-01-01 16:02:02  -2.0650     314.01 (16:02:12)          314.01 (bid)
2015-01-01 23:24:08   2.1549     315.34 (23:25:34)          315.34 (ask)            1.004    1.004
2015-01-02 01:05:52  -2.0041     312.87 (01:06:02)          312.87 (bid)
2015-01-02 23:32:02   2.2847     316.53 (23:32:08)          316.53 (ask)            1.012    1.016
2015-01-03 12:06:09  -2.4903     301.00 (12:06:10)          301.00 (bid)
2015-01-03 19:42:09   2.2369     297.78 (19:42:17)          297.78 (ask)            0.989    1.005
2015-01-03 19:51:20  -2.0698     294.98 (19:51:32)          294.98 (bid)
2015-01-03 20:33:17   2.0068     295.29 (20:33:25)          295.29 (ask)            1.001    1.006
2015-01-03 20:42:47  -3.9480     294.68 (20:42:51)          294.68 (bid)
2015-01-03 21:29:59   2.5941     289.25 (21:30:04)          289.25 (ask)            0.982    0.988
2015-01-03 21:38:31  -2.3946     288.20 (21:38:33)          288.20 (bid)
2015-01-03 22:39:27   2.7095     289.68 (22:39:28)          289.68 (ask)            1.005    0.993
...

2015-09-22 04:21:05  -2.4912     225.15 (04:21:14)          225.15 (bid)
2015-09-22 13:45:12   2.1367     230.83 (13:45:18)          230.83 (ask)            1.025   18.269
2015-09-25 05:23:22  -2.1092     233.50 (05:23:27)          233.50 (bid)
2015-09-25 14:18:25   2.1120     236.41 (14:18:35)          236.41 (ask)            1.012   18.497
complete record here
Remarks on these findings
In the initial attempt in defining a a simulation model we are working with
Bitstamp and BTCe historical trades only, as represented by the
bitstamp-btce chart series (Jan-Sep 2015)
Considering the swings between them, together with the large volumes in USD that take place,
the exchanges are of similar in size transacting roughly 3-5 million USD per day,
this was the initial motivation towards a trading attempt.
Separate to the analysis above, the API scripts that connect with the
software infrastructure and database so far runs stable on automated transaction
on its own logic and on small latencies, particularly on the European exchanges are fast and reliable, usually less than 2s.
With this experience and how the exchanges work, the model based on the Δ(-2,2) threshold
strategy, where Δ = is my normalisation function, as in the
bitstamp-btce-norm-shift series,
operating on these thresholds in real-time seems feasible.
To verify if the result will hold, in a real-time environment, in the
Aug-Sep 2015 series
I've provided charts on every 5 events, which can be considered a random sampling, and it can
be inspected if the 'proposed buy' or 'proposed sell' would be feasible starting at the
triggered "event-time". Likewise in the
Jan-Sep 2015 series
I've provided charts for every 7 events, inviting at this point a manual inspection.
Applying the function across multiple exchanges rather than between just two.
Here a simulation triggering on a Δ(-1,1) against the mean of the five largest
exchanges.
BTCe simulation (-1,1) againts mean-ind
This is the series introduced at the start suggesting a 28-fold cumulative gain
Here, 1-Jan-2015 to 26-Sep-2015 of the largest exchanges and their mean, labelled mean_ind
that the Δ(-1,1) function above is derived from
Major Exchanges 1-Jan to 26-Sep-2015
The cyan coloured line is what is considered the "true" price according to my estimation.